Debugging Tips with Chrome Dev Tools

Several Google Chrome debugging tips.
Published on July 25, 2020 by Mike Chilson
Browser Javascript Programming
2 min READ
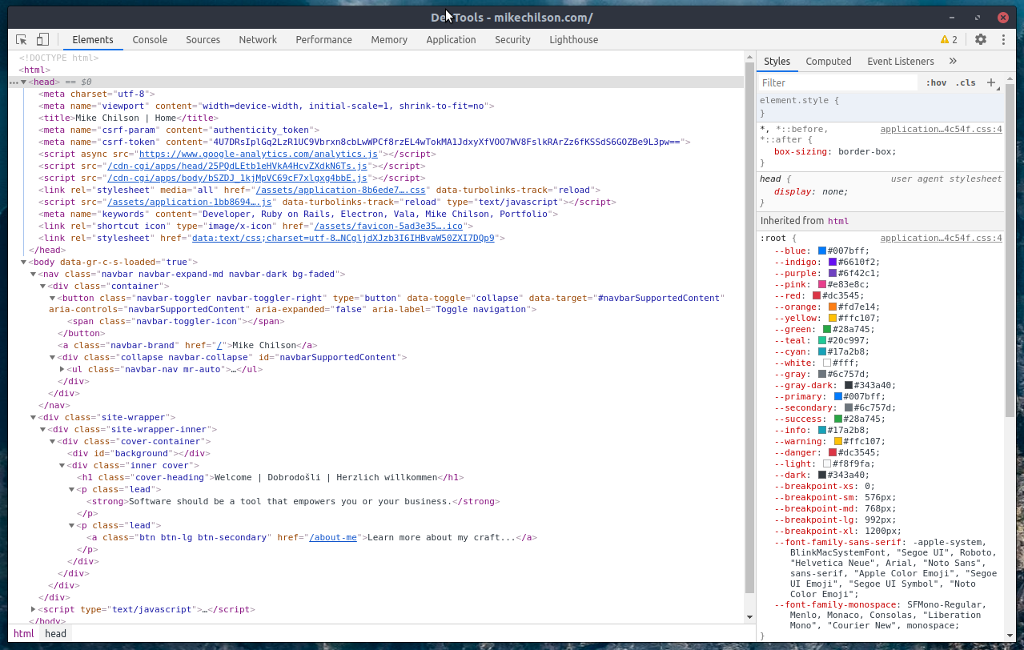
The Google Chrome web browser is the most popular web browser used by web developers today. With the Chrome browser having a six-week release cycle and a powerful set of developer features, Google has turned the browser into a tool all web developers can use. Most reading this may be familiar with many of its well-known features like live-editing the CSS of a page, using the console to check for errors and such, and debugging Javascript for example. In this post, I will share with you some cool tips and tricks that are not so well known and will improve your debugging even more. These are some of my favorites!
Search Within The Source Code

Need to find that class or variable? Use Dev Tool’s built-in search! To search in all files loaded on the page for a specific string, press [Ctrl] + [Shift] + [F] ([Cmd] + [Opt] + [F] on a Mac). This method of searching supports Regular expressions as well.
Selecting Elements In The Console

The DevTools console supports some handy magic variables and functions selecting DOM elements:
- $() - Short for document.querySelector(). Returns the first element, matching a CSS selector ( e.g. $(‘div’) will return the first div element in the page).
- $$() - Short for document.querySelectorAll(). Returns an array of elements that match the given CSS selector.
- $0 - $4 - A history of the five most recent DOM elements that you’ve selected in the elements panel, $0 being the latest.
To learn more Console commands read the Command Line API.
Pretty Print {}

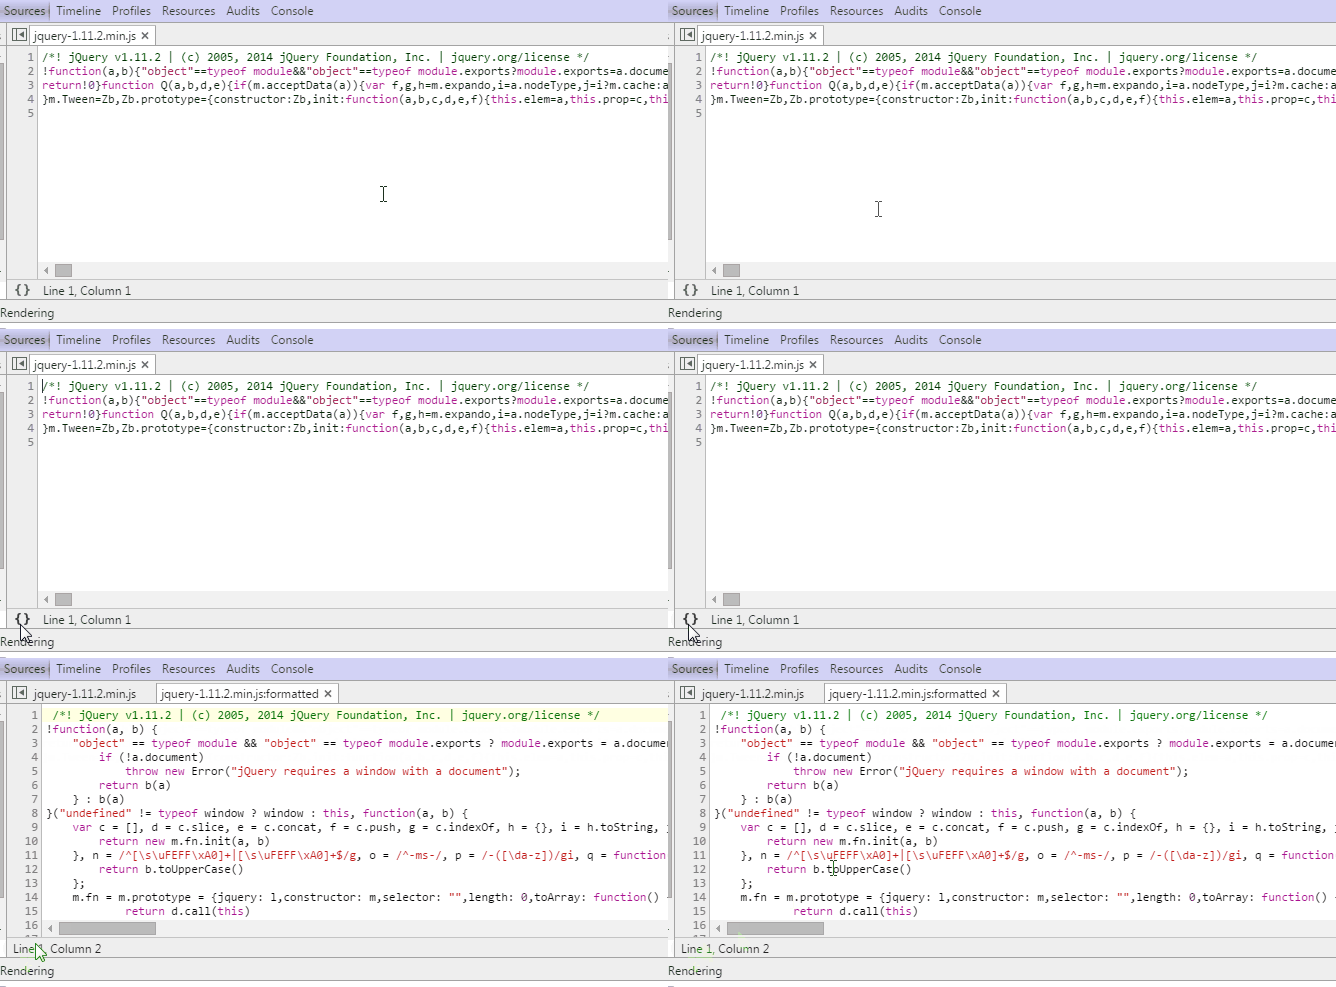
Chrome’s Developer Tools has a built-in code beautifier that will help you return minimized code to its humanly readable format. The Pretty Print button is located in the bottom left of your currently opened file in the Sources tab. Give it a try!
Select Next Occurrence

You can press [Ctrl] + [D] ([Cmd] + [D] on the Mac) while editing files in the Sources Tab, the next occurrence of the current word (or selected word) will be selected as well, helping you edit them simultaneously.